Insurance Customer Experience Dashboard - Design Case Study
The project
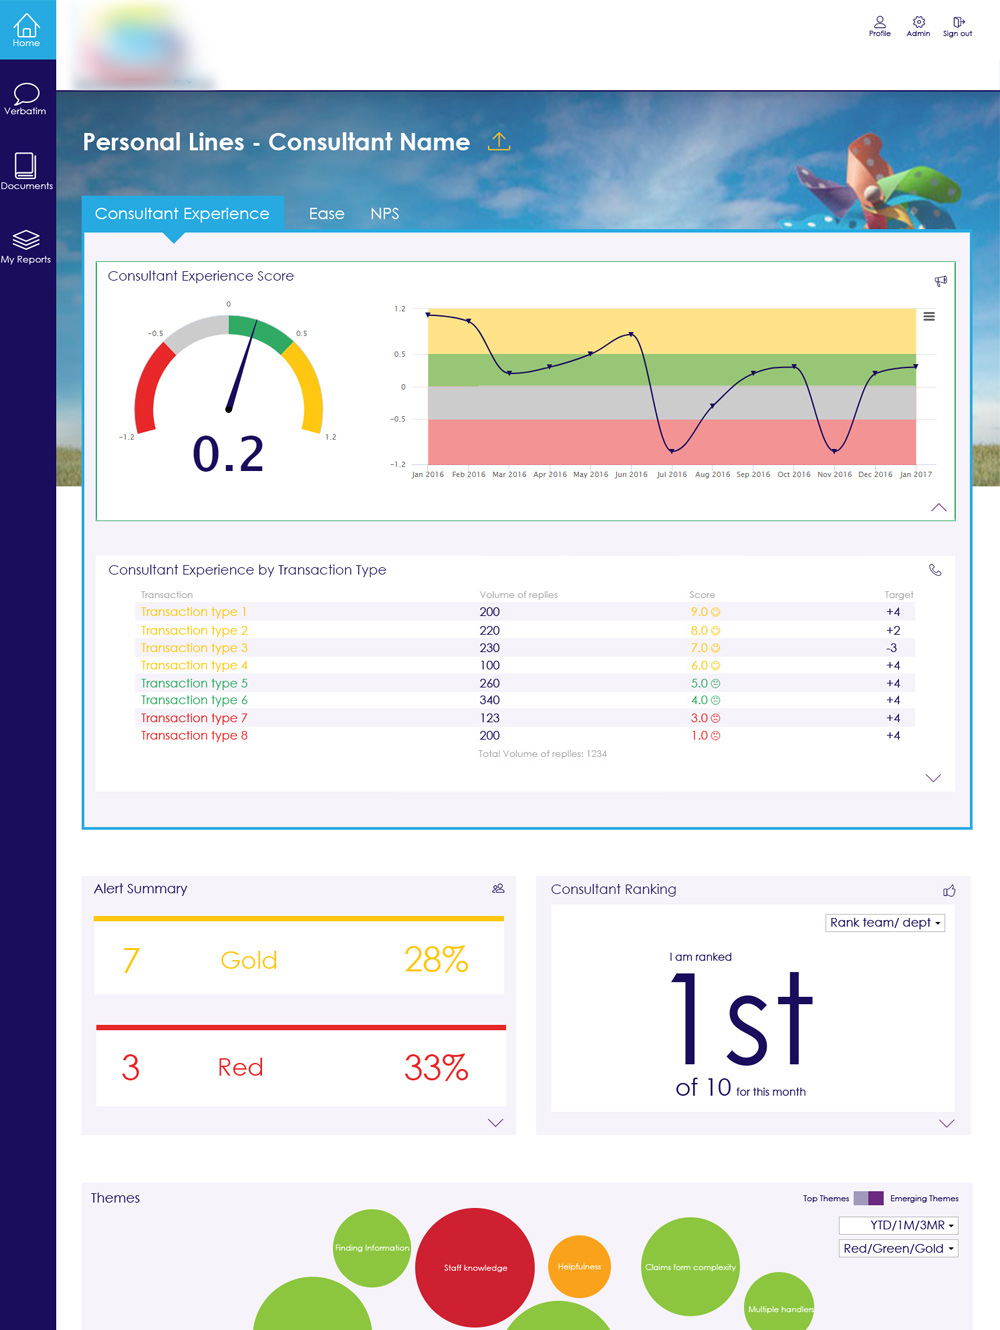
This national insurance company required a consolidated, web-based intranet dashboard product to improve their customer's experience (CX). As a solution we implemented KPMG's Insight Cloud customer survey analysis dashboard. Many thousands of users in the business used this dashboard in a day. A huge quantity of emails was sent each month, inviting customers to fill in a customer satisfaction survey. These surveys fed the data that made up the dashboard product. I improved the usability, accessibility and user journeys of the digital products. This led to improved actions on the data, and an award for the client.
The brand name is hidden in the screen shots to provide some client confidentiality. Dummy data is used to protect client data.
My role
Throughout the project I was the senior UI and UX designer. I led on all the UX design decisions. I created sketches, wireframes, mock-ups, prototypes and crafted all the HTML, CSS and the front-end user interface elements, ensuring the Insight Cloud dashboard was fully mobile responsive, brand compliant, met user needs, was accessible and easy to use. I delivered the dashboard product designs, working alongside account engagement managers, project managers, data and insight analysts, product managers and product software developers.
Discovery phase and researching the problem
Before our work customer service feedback was collated in an ad hoc manner by the client, and analysis was split between different software tools, which was time consuming to create. A single, integrated dashboard solution was required.
Client scoping
I joined our project management and data insight teams to determine what the client's aims were in using the dashboard while the various teams worked on determining survey questions.
Internal scoping
We had brainstorming white boarding sessions to determine what was of most value to the client, to then advise what was in project scope.
Defining the user and client requirements
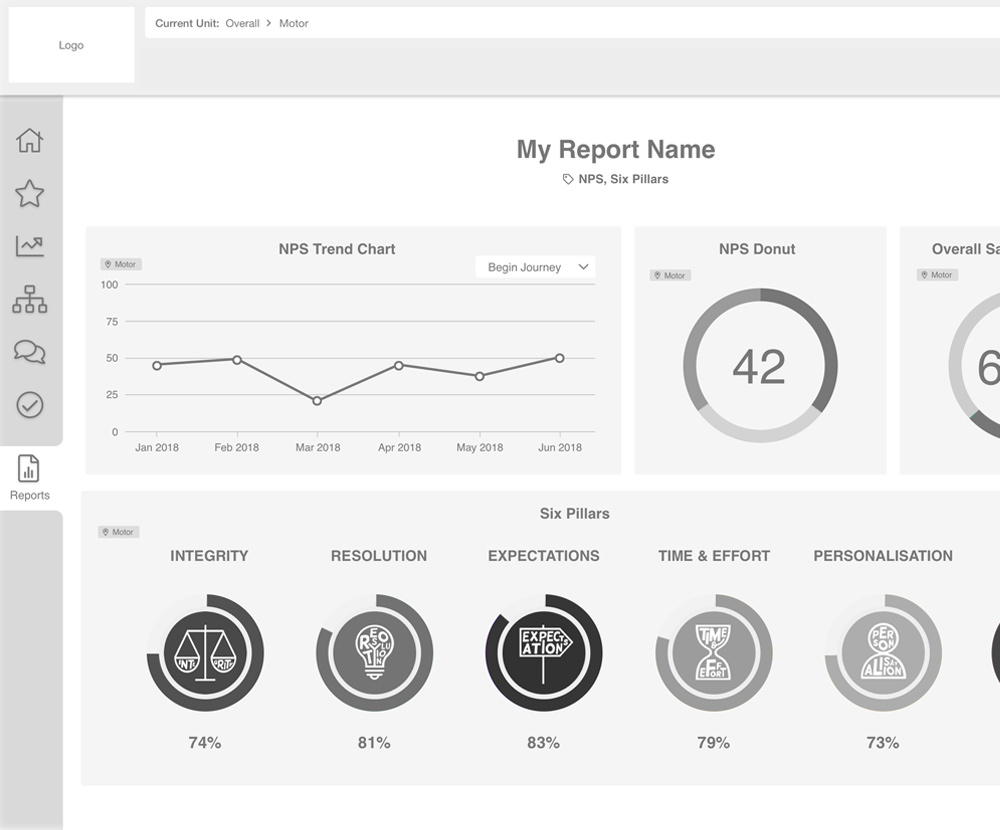
Survey questionnaire answer types were mapped to the types of charts on the dashboard in a schematic document, this structured the content for business and user needs.
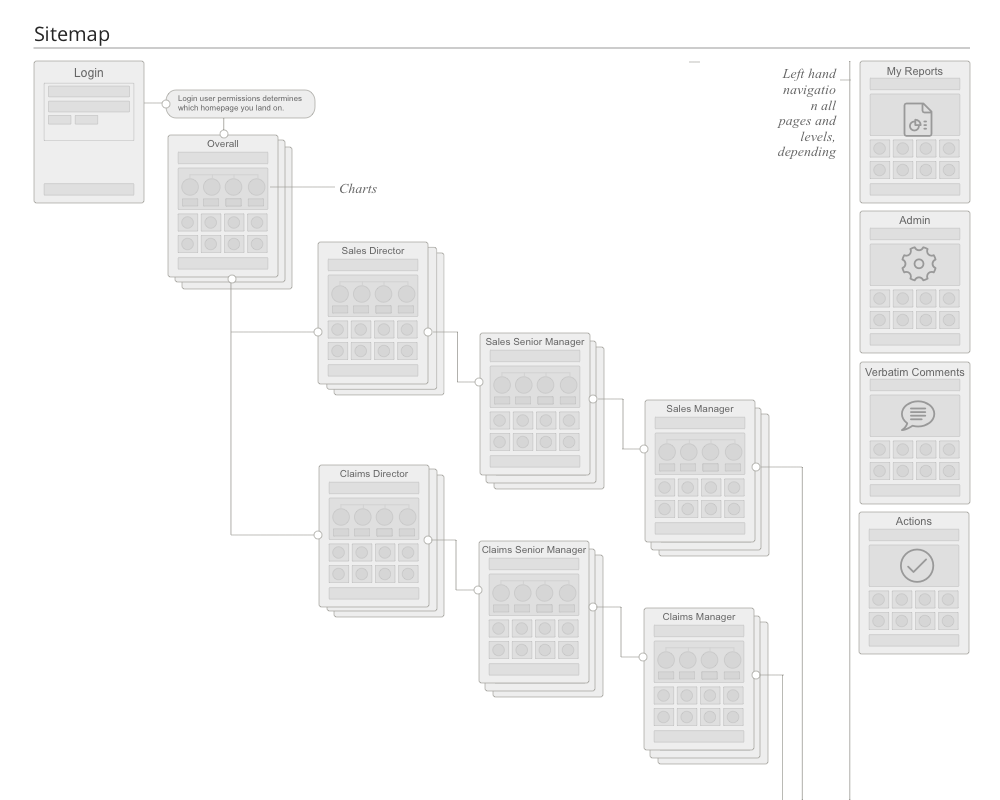
User journey and user flow
I created flip chart diagrams and white board wireframes in client brainstorming sessions, determining the charts and questionnaire data each user group could see, and the basic information architecture. This led to a finalised sitemap and basic user flow.
Research
We studied the types of users that would use the dashboard product.
User groups and personas
GOALS:
- Monitor team’s performance against targets.
- Easily spot where team’s performance was below that of other teams.
FRUSTRATIONS:
- Only needs top-line reporting and strategic detail.
DASHBOARD USAGE:
- In office. Just need basic overview.
GOALS:
- Analyse team performance against targets.
- Create actions from the feedback for the team.
FRUSTRATIONS:
- Need easy access to agent performance.
DASHBOARD USAGE:
- In office to access feedback for agents.
GOALS:
- To get regular feedback on their performance.
- To understand from customer comments how to improve.
FRUSTRATIONS:
- Difficulty in seeing patterns of problems.
DASHBOARD USAGE:
- In office at a desktop PC.
GOALS:
- Overview of high-level customer service feedback.
- Identify regular customer problems from the themes and comments.
FRUSTRATIONS:
- Need simple displays of information, with accurate top-line scores.
DASHBOARD USAGE:
- In office. Need score overviews.
GOALS:
- Measure agent performance against targets.
- Easily spot where team’s and agent performance is below that of others.
FRUSTRATIONS:
- Needs easy to use, close to real time top-line reporting.
DASHBOARD USAGE:
- In office on a desktop PC, usually in call centre setting.
GOALS:
- To get regular feedback on their performance.
- To create actions from customer comments to improve service.
FRUSTRATIONS:
- Seeing how close they are to target for their performance.
DASHBOARD USAGE:
- In office on a desktop PC in call centre.
Design development of potential solutions
With the things we discovered from the client requirement gathering phases, I refined the design ideas for the dashboard.
Ideation – brainstorming
We started to design a more fleshed out structure of the dashboard divided by client department and user divisions with the key chart types. We also had further client and internal flipchart and whiteboard brainstorming sessions.
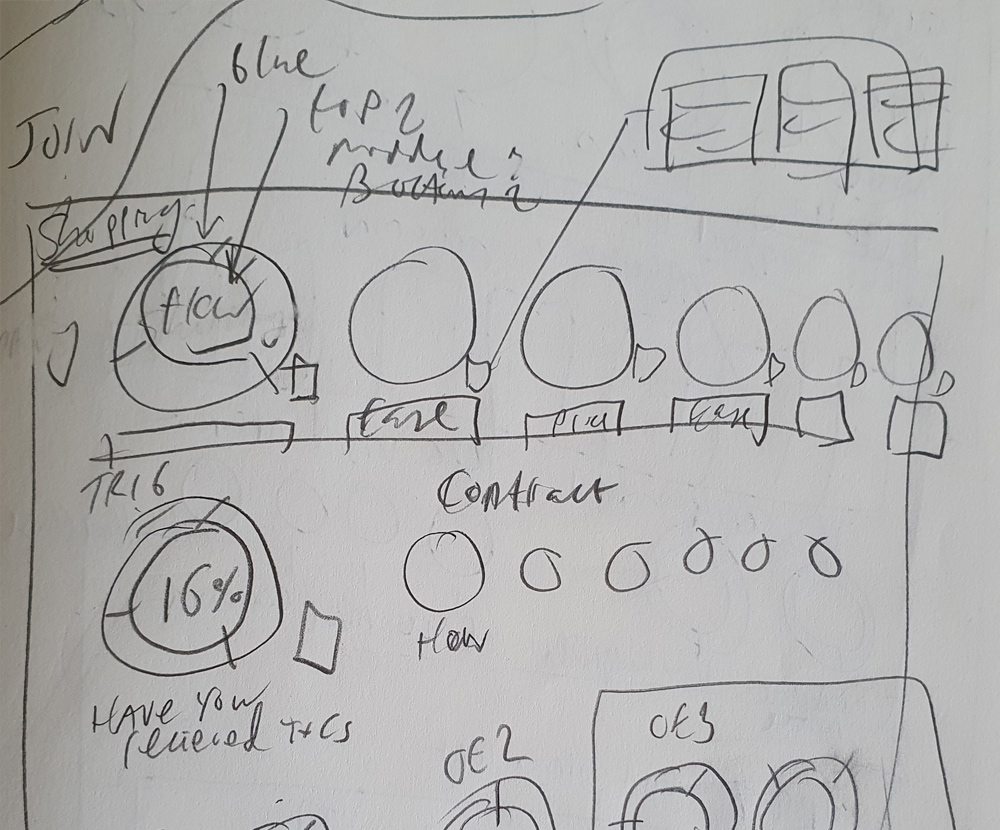
Sketching, wireframes and user feedback
With a better idea of structure and content, I began to sketch the layout in my sketchbook and then produced low fidelity wireframes to test with client in office users of the dashboard.
Design delivery
I created a variety of design assets for this project:
Low fidelity dashboard wireframes
- Designs in Sketch.
- Prototypes in Invision.
- Tested with client users.
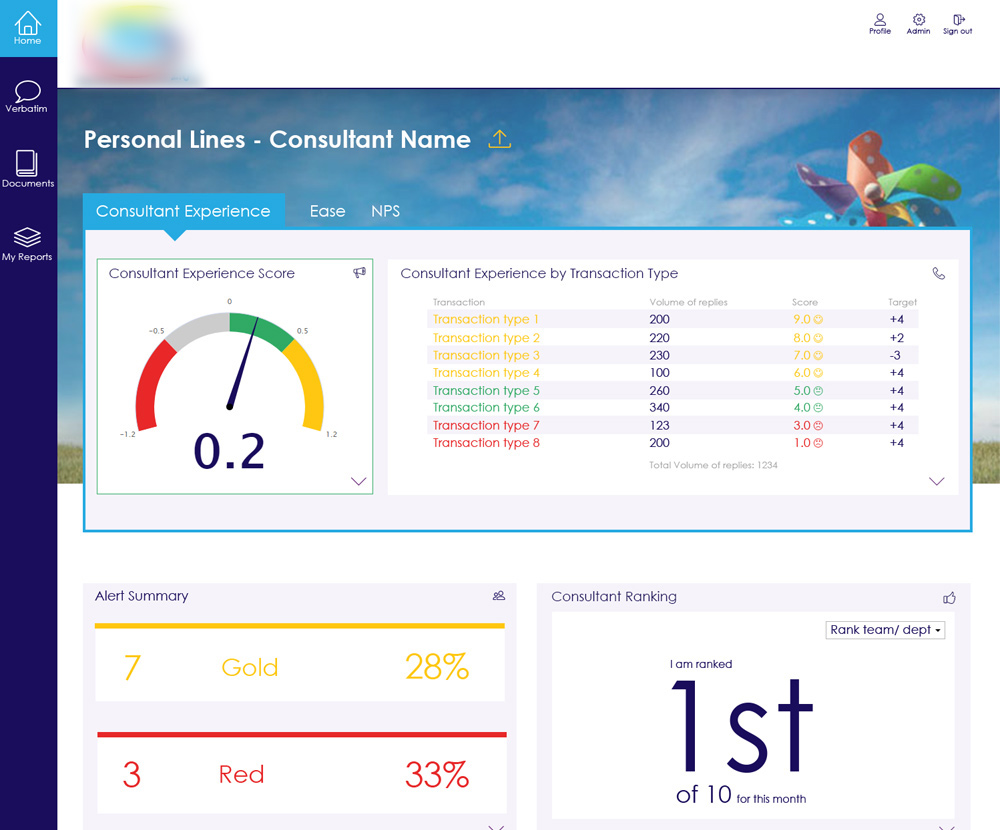
Final designs
- Fully branded designs in Sketch.
- Prototypes in Invision.
- Tested with client users.
Build phase
We rolled out the main components of the fully functional dashboard product to the client in several build phases.
Dashboard build
- Agile sprints, with coding best practice were used throughout the build phase.
- Implementation Team colleagues provided charts and data, and I worked with them to style this content.
- I created HTML, LESS, CSS, images, fonts and front-end user interface elements and added them to the product using GIT.
- Charts were created in the front-end Highcharts JS plugin and I styled these.
- The dashboard was created as a fully responsive, mobile web delivered piece of software.
Support phase
A UAT test site was used for the client to view and give iterative feedback and we performed a variety of bug testing and refinement stages in an agile way.
User feedback and iteration
- Observations of users using the dashboard.
- Stakeholder feedback sessions.
- Accessibility, UAT testing and QA.
User guide
User guides were designed in Adobe InDesign CC to help the client in the training and support of the product.
Results and reflections
- The customer satisfaction rating improved with the design of the dashboard product for the client, helping call staff improve their skills and customer service delivery.
- The CX improvement programme won the client a Customer Excellence award.
- I improved the usability of customised branded dashboard, as seen in user feedback.
- Survey completion and engagement increased, based on our analytics.
- I improved the accessibility of the surveys and dashboards. This was measured in our benchmark tools.
- I improved cross functional team dialogue, noted by feedback.
- Insight Cloud licenses renewed. Sales increased.